Virus infection models
In Vivo Systems Models Summary
The first mathematical model to describe IAV dynamics was developed in 1976 by Larson et al.. The model was fitted to viral titer data of mice infected with IAV (H3N2). After thirty years without modeling efforts, a work that described
the IAV infection dynamics was presented by Baccam et al., which adopted the well-known target cell model.
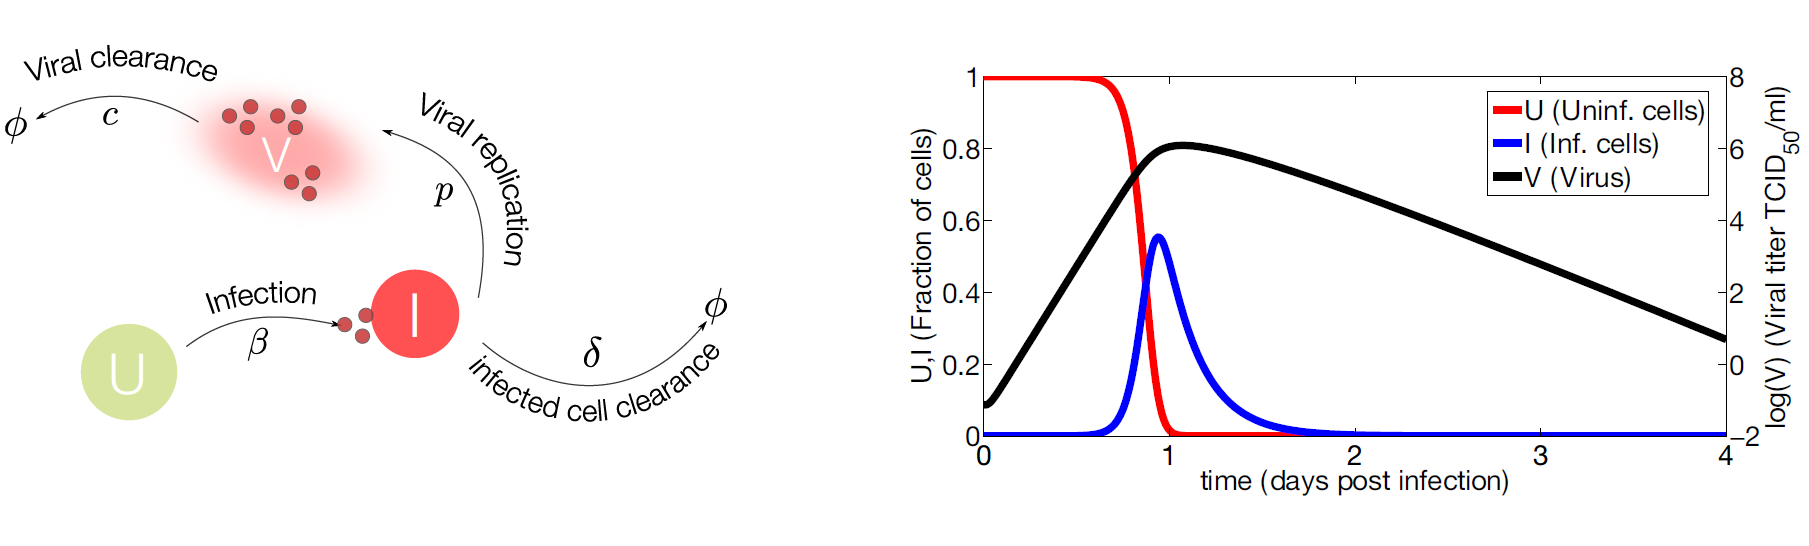
Figure 2. Target cell model.
- (Left) IAV (
V) infects susceptible cells (U) with rateβ. Infected cells are cleared with rateδ. Once cells are productively infected (I), they release virus at ratepand virus particles are cleared at ratec. The symbolΦrepresents clearance; - (Right) Computational simulations of the target cell model. Parameter values used for model simulation are taken from [26]. The susceptible cells (red line) are rapidly infected while the virus (black line) and infected cells (blue line) peak at day one approximately. The viral growth is limited by the number of susceptible cells, decreasing the viral load and the number of infected cells to undetectable levels.